Billboard Creative, Tested / Review 03
McDonald’s Billboard Review: A B for “Two for $3.33” and a C for “Thirst Can’t Hide”
One brand, two boards, and a full grade band between them. The gap comes down to how much each board asks a driver to read, and how well the headline separates from the red.
Review disclosure: I created Ad Corrector. This is an editorial assessment of third-party creative using my own tool. Calculated findings and my interpretation are identified separately.
Short answer: McDonald’s “two for $3.33” billboard scored B with an 85/100 weighted visibility index, and “Thirst can’t hide” scored C with 73/100. Both were tested in Brand Awareness mode on a 14 × 48 foot bulletin at 65 mph and 600 feet. That is a legibility and visual-clarity comparison. It does not show which board sold more.
The first board carries 8 entered words and a headline measured at 4.81:1 contrast. The second carries 16 and measured 3.50:1. The Thirst board scores higher on Colors (100% against 78%) and Composition (95% against 92%), yet it grades lower. Copy Length and Contrast are what hold it back.
This is the third standalone article in Billboard Creative, Tested, and the first to put two boards from one advertiser side by side. The Uber review examined brand hierarchy and restraint, and the Chick-fil-A review examined wordplay and brand cues. This entry examines reading load and headline contrast.
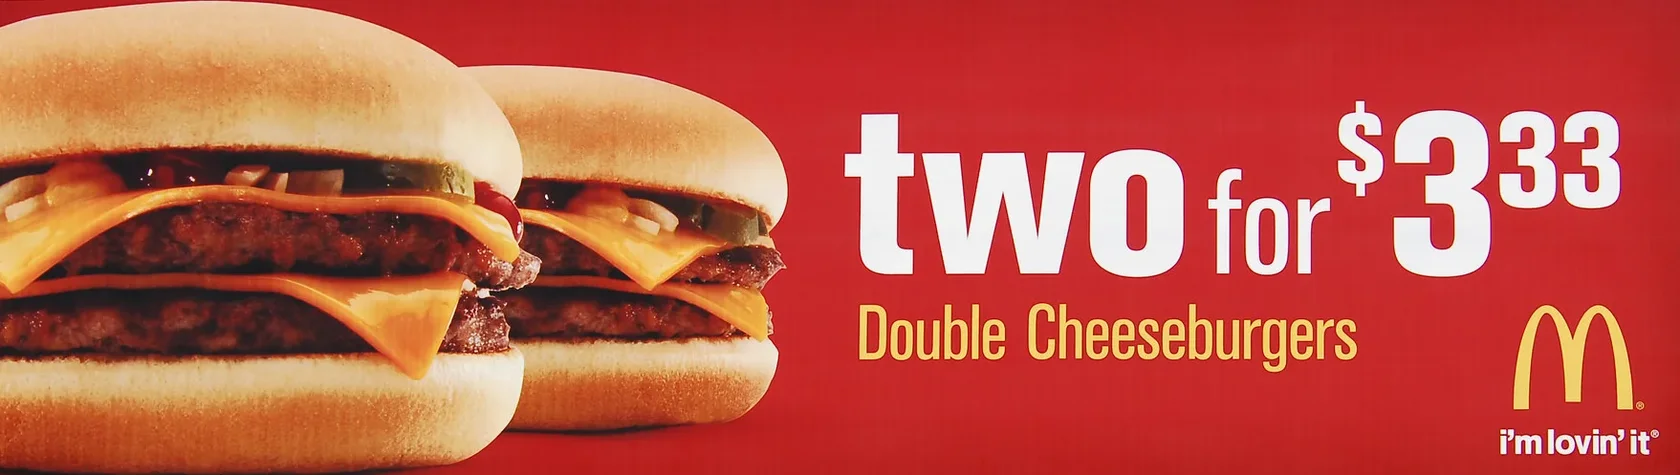
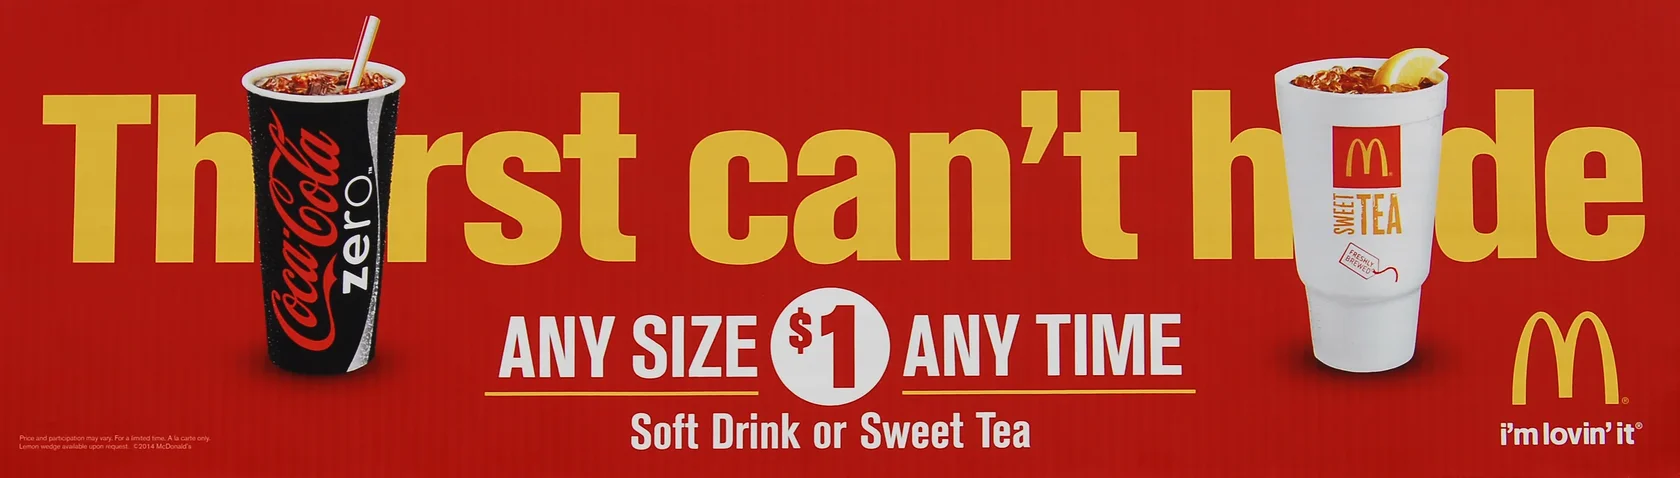
Both photographs show eastbound boards on the Santan Freeway (Loop 202) in Chandler, Arizona, according to their Flickr pages. Photographer credits and links are in Sources and review record. McDonald’s and related names, marks, and products are trademarks of their respective owners.
What earned a B, and what held a C
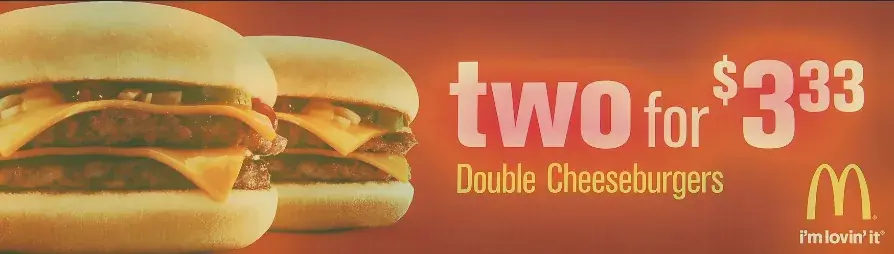
“two for $3.33”
85/100 weighted visibility index
- 8 entered words
- Constraint: Contrast (72%)
- Estimated reading time fits the 6.3 seconds in view
“Thirst can’t hide”
73/100 weighted visibility index
- 16 entered words
- Constraint: Copy Length (49%)
- Estimated reading time runs about 0.6 seconds past the time in view
What do the grades mean? Each supplied photograph performed within Ad Corrector’s rule-based visibility calculation under the selected inputs. They do not mean a given share of drivers read, understood, or acted on either board.
| Input | Board A: “two for $3.33” | Board B: “Thirst can’t hide” |
|---|---|---|
| Campaign goal | Brand Awareness; CTA scoring excluded | Brand Awareness; CTA scoring excluded |
| Selected format | Bulletin, 14 × 48 feet | Bulletin, 14 × 48 feet |
| Speed and viewing distance | 65 mph / 600 feet | 65 mph / 600 feet |
| Entered primary message | two for $3.33 | Thirst can’t hide |
| Entered supporting copy | Double Cheeseburgers; i’m lovin’ it | ANY SIZE $1 ANY TIME; Soft Drink or Sweet Tea; i’m lovin’ it |
| Total entered words | 8, as counted in the report | 16, as counted in the report |
| Text measurement coverage | Headline and supporting copy located; includes user-confirmed text areas | Headline and supporting copy located; includes user-confirmed text areas |
| Input image | 1757 × 497 pixel photograph | 2663 × 758 pixel photograph |
| Report completed | November 20, 2026, 1:03:03 PM | November 20, 2026, 1:05:47 PM |
The format, speed, and distance are review assumptions, not verified details of a campaign placement. The inputs were supplied photographs, not verified production exports. Ad Corrector does not publish the weights behind the weighted index, so I treat it as a summary of the report and read the component indices next to it.
| Check | Board A | Board B | Practical reading |
|---|---|---|---|
| Copy Length | 96% | 49% | Board A’s eight words fit the copy guidance. Board B’s sixteen words are its primary constraint, flagged as a priority. This does not measure letter height. |
| Contrast | 72% | 57% | Board A’s lowest sampled headline separation is 4.81:1, a suggested refinement. Board B’s is 3.50:1, flagged as a priority. |
| Clarity | 86% | 72% | Board B is told to reduce competing details around the main message, a suggested refinement. Board A is not flagged. |
| Colors | 78% | 100% | Board B’s palette meets the tool’s color checks at the top of its scale. Board A’s 78% is listed as a refinement. |
| Composition | 92% | 95% | Both layouts score well. Composition does not measure how much copy the board carries. |
| Persuasion Engine | 86 / 100 | 77 / 100 | A derived interpretation of the same technical findings, not an audience measurement. |
Read the table across, not down. Board B wins two rows and still loses the grade, which is the reason to look at the components instead of the letter alone.
The gap comes from reading load and headline contrast
Eight words against sixteen
At 600 feet and 65 mph, a driver has about 6.3 seconds. Ad Corrector’s reference estimate puts Board A at 4.4 seconds to read and Board B at 6.9. That reading-time check is display-only and does not change either grade. Board B’s 49% Copy Length index is flagged as a priority and is the tool’s primary constraint for that board. For more on the numbers, see How Many Words Should a Billboard Have? and How Long Do Drivers Have to Read a Billboard?
White on red against gold on red
Board A sets white lettering on red and sampled 4.81:1 for its headline. Board B sets gold lettering on red and sampled 3.50:1. Board B’s headline is its lowest sampled primary separation, and its Contrast index is 57% against 72% for Board A. Neither is a failure of color choice on its own. Gold on red is a recognizable McDonald’s pairing. The measurement says the separation is thinner than on the other board.
Letters under the cups
On Board B, the two cups overlap letters in “Thirst” and “hide.” Ad Corrector’s text recognition read the headline as “Th rst can’t,” and I corrected the field by hand before scoring. Whether the overlap is deliberate wordplay or simply how the pieces were arranged, the score cannot say whether a driver fills in the missing letters.
A pleasing layout and a quick read are separate questions.
Board B’s Colors (100%) and Composition (95%) are real strengths. They are also the reason the grade surprises people. A board can be well composed and still carry more than the viewing window allows.
Use the visual previews to inspect the hierarchy
Speed View is an illustrative motion-blur effect at the selected speed and distance. It is not a recording or prediction of driver vision. The heatmap marks local light-dark variation and does not measure attention. Neither view changes the grade.
Speed View, 65 mph / 600 feet
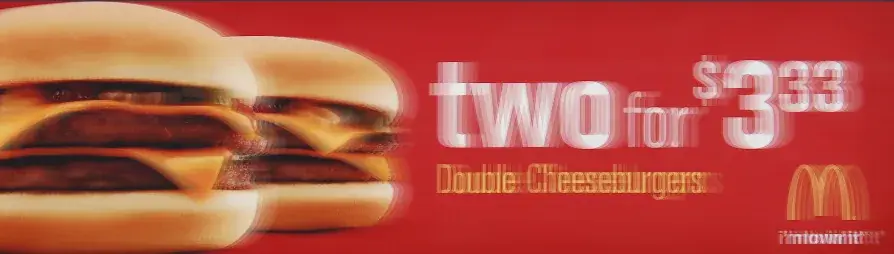
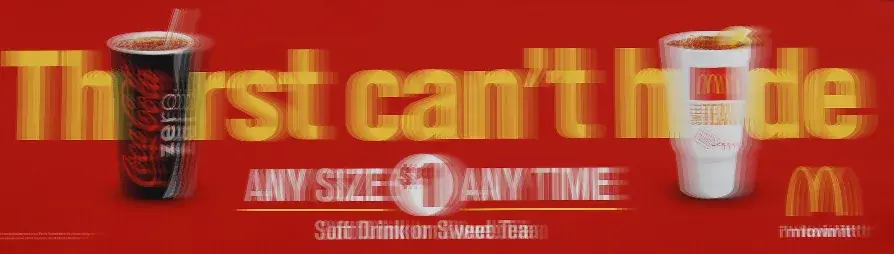
Image-detail heatmap
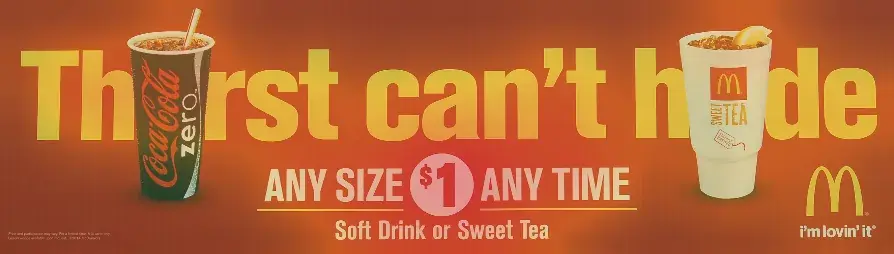
The relationship I would inspect is how much of each board is competing with the headline. Board B places a tagline, an offer, a product line, and two cups in the same field. Use the previews as an image-detail guide, not as evidence of what a driver sees.
Both boards slip one step at 75 mph
| Setting | Board A | Board B |
|---|---|---|
| 55 mph, 600 ft | B+ (Clarity 94%) | C (Clarity 80%) |
| 65 mph, 600 ft (selected) | B (Clarity 86%) | C (Clarity 72%) |
| 75 mph, 600 ft | B- (Clarity 72%) | C- (Clarity 60%) |
| 65 mph, 480 ft | B (Clarity 86%) | C (Clarity 72%) |
| 65 mph, 720 ft | B (Clarity 84%) | C (Clarity 72%) |
| 75 mph, 720 ft | B- (Clarity 70%) | C- (Clarity 60%) |
Each row recalculates Clarity and the overall grade; other scores stay fixed. Lighting, screen brightness, and physical display performance are not modeled.
At 75 mph, Board A drops from B to B- and Board B from C to C-. Neither board changes letter band across the 480 to 720 foot range at 65 mph. If your placement runs faster than 65 mph, look at the 75 mph row for your own board and keep it separate from the baseline grade.
A lower grade is not a verdict on the idea
Board A is built around one price and one product. Board B is built around a tagline, with the offer in a second tier and the product in a third. They are doing different jobs, and the test only measures how readable each job is under the same conditions.
“Thirst can’t hide” may be the more memorable idea. “Two for $3.33” may be the more direct offer. We did not observe either response. The score also cannot say whether the promotion performed. For more on that gap, see Why Billboard Visibility Doesn’t Equal Understanding.
Board A’s 85 against Board B’s 73 tells us how much each board asks of a driver in a few seconds. It tells us nothing about which campaign was remembered more or sold more.
My verdict: cut the offer line, lift the headline
I would keep Board A’s structure: one price, one product, one brand mark. The tool’s Fix First item is headline contrast, which is a refinement rather than a rebuild.
On Board B, I would protect the headline idea and the strong color and composition scores, then reduce the reading load. The offer and product lines carry the most words, and cutting them is the quickest route to a read that fits the window. The cups also deserve a second look. If the covered letters are not deliberate, they cost the headline legibility for no gain.
The scores support the technical review. Whether either board should run still depends on the brief, the placement, and the audience.
Five checks to borrow for your own board
These checks come from what this review recorded. They apply whether your board sells a burger, a service, or a brand.
- Count the words before you design. Eight entered words fit the window here, and sixteen ran about 0.6 seconds over. Ad Corrector’s reference estimate is 0.31 seconds per familiar word plus 1.94 seconds. See How Many Words Should a Billboard Have?
- Measure the headline against its own background. White on red sampled 4.81:1 and gold on red sampled 3.50:1. A familiar brand color pairing can still leave a thin margin. See Best Colors for Billboards.
- Keep the letters that carry the idea in view. When a product image covers letters, even the tool’s text recognition stumbled. Check the headline with every graphic layered on top.
- Do not let strong color and composition hide a heavy message. Board B scored 100% on Colors and 95% on Composition and still graded C. Read the Copy Length row before the letter grade.
- Test a faster scenario. Both boards dropped one step at 75 mph. If your road is faster, check that row, and check letter height at the distance you expect.
What this test can and cannot show
- Valid: the scores come from the supplied pixels of each photograph, the entered copy, and the viewing settings stated on this page. The numbers are real output from the November 20, 2026 runs.
- Assumed: Bulletin, 14 × 48 feet, 65 mph, and 600 feet are standard test settings. The photographs do not state the structure size, posted speed, or sightline.
- Source quality: both images are photographs of finished boards, not production files, and they date from 2014. Board A is 1757 × 497 pixels and Board B is 2663 × 758 pixels. Camera angle, exposure, and compression can shift sampled contrast.
- Not modeled: glare, lighting, weather, physical display performance, and what a driver already knows about the brand.
- Excluded: the small legal line on Board B was left out of the entered copy.
- Scope: two boards from one brand are a case study, not a benchmark.
How these reviews work
Each entry starts with independently created advertising and a recorded set of test inputs. Ad Corrector applies rule-based checks to the image, confirmed copy, campaign goal, and selected conditions. The review then explains the findings in plain language.
The screenshots and report provide the test record. The commentary supplies editorial judgment. Where a placement detail is unknown, it is identified as an assumption. Where a result cannot answer a question, that limit stays visible.
The reasoning behind the approach is documented on the Scientific Foundations page. Common Methods Used to Test Billboard Ads covers other testing methods and their limits, and the billboard testing glossary defines the terms used here.
Questions about these McDonald’s billboard tests
Which McDonald’s billboard scored higher in Ad Corrector?
The “two for $3.33” board scored B with a weighted index of 85/100. The “Thirst can’t hide” board scored C with a weighted index of 73/100. Both were tested in Brand Awareness mode at the same settings: Bulletin (14 × 48 feet), 65 mph, 600 feet.
Why did “Thirst can’t hide” score lower?
Its primary constraint is Copy Length (49%), with 16 entered words against 8 on the other board. Its headline also measured 3.50:1 for contrast, against 4.81:1 for the “two for $3.33” headline. The reference reading-time estimate for the Thirst board is 6.9 seconds against 6.3 seconds in view. That check is display-only and does not change the grade.
Does a higher grade mean the billboard sold more?
No. The grades are rule-based visibility indices for the artwork as supplied and the viewing conditions selected. They are not probabilities of readability, comprehension, or campaign success, and they do not measure offer strength, media placement, or sales.
Why were both boards tested in Brand Awareness mode?
Neither board carries an exit, address, phone number, or web address in its main message, so there is no direction to act on. Brand Awareness mode excludes CTA scoring, and the absence of a call to action was not penalized.
Was the small legal text on the Thirst board counted?
No. The small legal line at the lower left of the “Thirst can’t hide” artwork was left out of the entered copy because it is not meant to be read from the road. The entered copy counted 16 words: the headline, “ANY SIZE $1 ANY TIME,” “Soft Drink or Sweet Tea,” and “i’m lovin’ it.”
How does Ad Corrector estimate reading time?
It uses its own reference estimate of 0.31 seconds per familiar word plus 1.94 seconds. That is not a published study and has not been validated in the field. Time in view is viewing distance divided by speed, so 600 feet at 65 mph is about 6.3 seconds.
What happened when the cups covered letters in the headline?
Ad Corrector’s text recognition read the headline as “Th rst can’t,” and the field was corrected to “Thirst can’t hide” before scoring. The score reflects the corrected text and the outlined areas. It does not model whether a driver would fill in the covered letters.
Are these McDonald’s billboards still running?
We cannot confirm. The photographs were posted to Flickr in 2014, and this review treats the artwork as a historical sample of out-of-home creative, not as current McDonald’s advertising.
What are the limits of this comparison?
Two boards from one brand are a case study, not a benchmark. The test assumes a Bulletin format, 65 mph, and 600 feet because the photographs do not state the structure size, posted speed, or sightline. Camera exposure, glare, lighting, and physical display performance are not modeled.
Sources and review record
Creative source, Board A: “McDonald’s billboard - Santan Freeway Loop 202, Chandler, AZ” by Jim Ritterhouse (Flickr: azbillboard), taken June 16, 2014. The Flickr page lists “All rights reserved.”
Creative source, Board B: “McDonald’s billboard - Santan Freeway Loop 202, Chandler, AZ” by Jim Ritterhouse (Flickr: azbillboard), taken April 22, 2014. The Flickr page lists “All rights reserved.”
Test evidence: the author-run November 20, 2026 reports and screenshots. Board A’s report was completed at 1:03:03 PM and Board B’s at 1:05:47 PM. Text regions include user-confirmed areas. No audience study, field observation, or campaign outcome data was supplied.
This is an independent editorial assessment for commentary and analysis. It is not a commissioned McDonald’s study, and it is not affiliated with or endorsed by McDonald’s. McDonald’s, the golden arches, “i’m lovin’ it,” and related names and products are trademarks of their respective owners. Source credits identify where the creative was found, not who owns the rights to it.