Billboard Creative, Tested / Review 01
Uber “We Move You” Billboard Review: Grade A and a Case for Restraint
A large brand name. Three supporting words. One photograph. This execution gives us a useful place to begin.
Review disclosure: I created Ad Corrector. This review applies my tool to third-party artwork and separates its calculated findings from my editorial judgment.
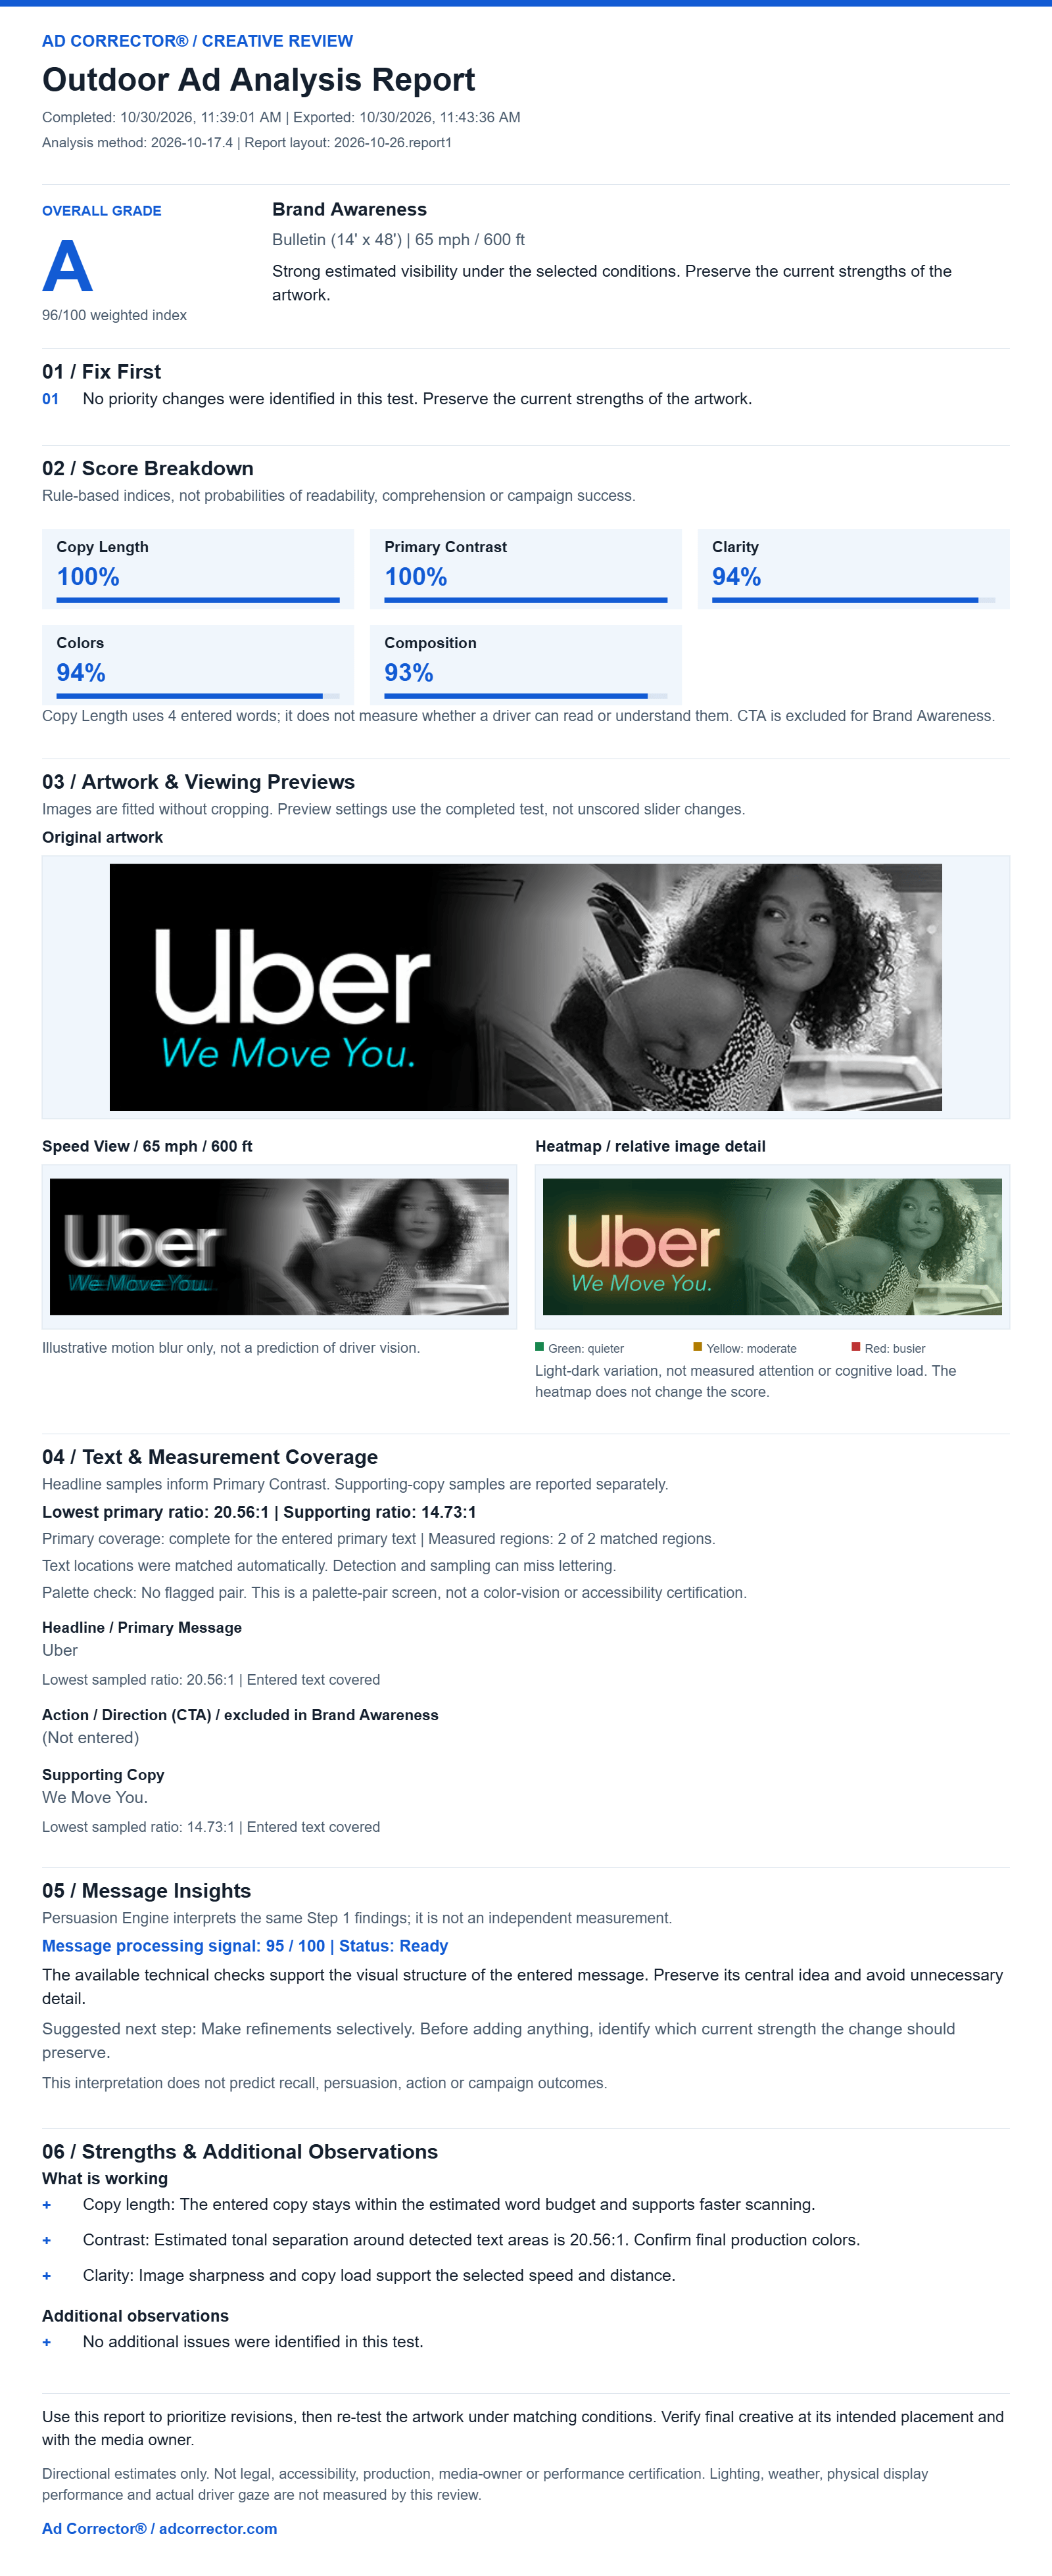
Short answer: Uber’s “We Move You” billboard artwork scored grade A and a 96/100 weighted visibility index in Ad Corrector, in Brand Awareness mode on a 14 × 48 foot bulletin at 65 mph and 600 feet. The test identified no priority changes. That is a legibility and visual-clarity result. It does not measure recall, emotional response, persuasion, or ride bookings.
A billboard deserves more than “I like it.” It also deserves more than a grade with no explanation. This is Review 01 in Billboard Creative, Tested, which examines one outdoor ad at a time: the artwork, the test conditions, the findings, and the judgment those findings still require.

The result: a strong visibility score, with more to discuss
96/100 weighted visibility index
Ad Corrector identified no priority changes in this test. Brand Awareness mode. Bulletin format, 14 × 48 feet. Selected conditions: 65 mph and 600 feet.
Its short copy, high sampled text contrast, and relatively simple layout are consistent with a strong result under these conditions. The result supports preserving those qualities. What it cannot tell us is what viewers remembered, felt, or did afterward.
What was actually tested?
| Setting | Value used |
|---|---|
| Campaign goal | Brand Awareness |
| Selected format | Bulletin, 14 × 48 feet |
| Selected speed and distance | 65 mph / 600 feet |
| Primary message entered | Uber |
| Supporting copy entered | We Move You. |
| Call to action | Not entered; CTA scoring excluded in Brand Awareness mode |
| Analysis method version | 2026-10-17.4 |
These are review assumptions, not verified facts about a real Uber placement. The input was a web-sourced screenshot rather than a verified production file. Resolution, compression, and export differences can affect image-based findings.
The score breakdown
| Check | Index shown | How to read it |
|---|---|---|
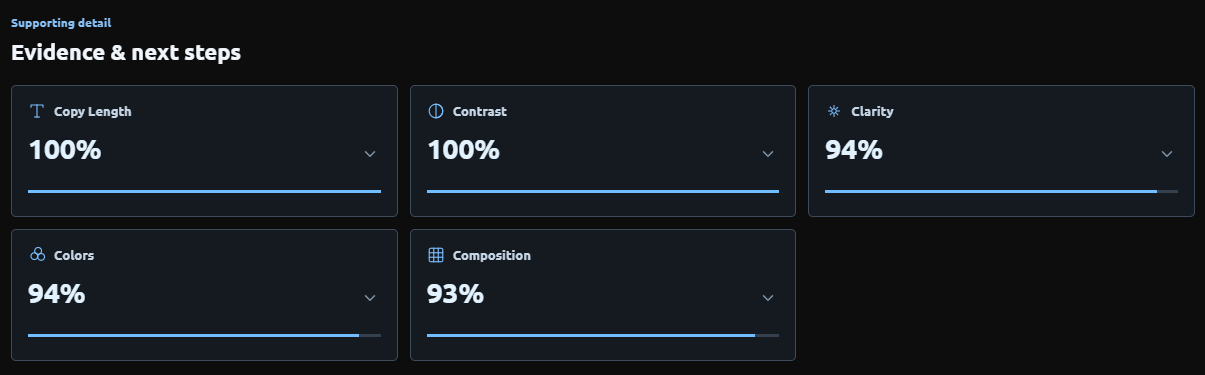
| Copy Length | 100% | The four entered words fit the tool's copy-length guidance for this setup. |
| Primary Contrast | 100% | The sampled primary lettering has strong tonal separation from its background. |
| Clarity | 94% | A strong calculated result under the selected conditions. |
| Colors | 94% | The palette performs strongly within the tool's color checks. |
| Composition | 93% | The image's measured structure performs strongly within the composition calculation. |
These percentages are rule-based indices. A Clarity result of 94% does not mean 94% of drivers can read the ad. Copy Length evaluates the entered wording against copy guidance; it does not measure physical letter height or establish complete comprehension.
What I see before looking at the score
The brand name has room to do its job. White lettering sits against a dark field, with “We Move You.” underneath in turquoise. The photograph occupies the right side. There is no offer to decode, no list of services, and no additional contact information competing with the central message.
My reading is that the photograph gives the line a human context. “Move” can describe transportation. Paired with the person in the image, it also invites an emotional interpretation. That is an editorial reading of the execution. The tool has not measured whether an audience makes that connection.
The restraint is worth examining. Every additional line would need to earn its place. For the opposite problem, see Why Saying More on a Billboard Usually Backfires.
Why the contrast finding needs a closer look
The report lists a lowest sampled primary contrast ratio of 20.56:1 and a supporting-copy ratio of 14.73:1. The primary message entered was “Uber.” The supporting text was “We Move You.”
That distinction matters. The headline and the tagline are not interchangeable measurements. A strong primary score should not be used to claim that every part of the design receives identical treatment.
The report records two measured regions out of two matched regions, and complete coverage of the entered primary text. It also notes that automatic matching and sampling can miss lettering. These are measurements from the supplied image, not verification of final ink, digital-display output, or physical letter height.
What the previews add
Motion preview
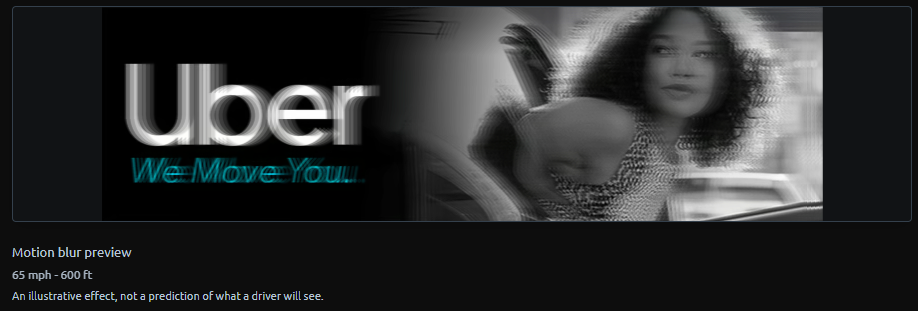
In this preview, the large brand name remains more visually prominent than the supporting line. That gives us a practical discussion point: which information deserves the greatest emphasis?
Here, the brand leads. The line supports it. I would preserve that relationship before considering decorative changes or adding more copy. The preview helps frame that decision; actual recognition would require observation with people.
What the heatmap shows
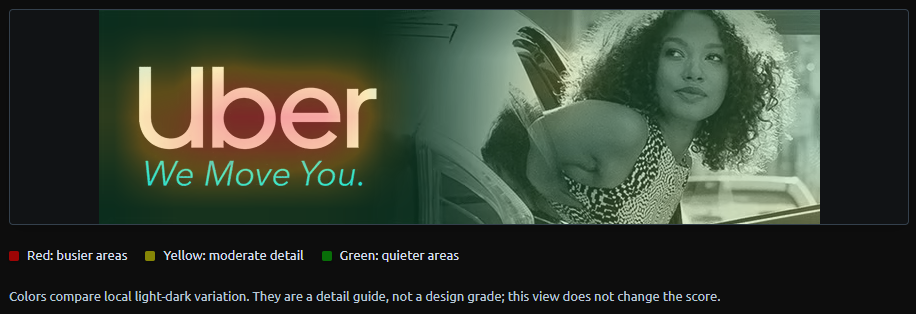
The warm area around the wordmark corresponds to local image variation in that region. It is not evidence that viewers look there first. Green areas are not proof that people ignore the photograph.
This distinction keeps the review honest. An eye-tracking study records gaze. This heatmap provides a calculated image-detail guide. Use it to inspect the artwork, then explain what the calculation actually represents.
The Persuasion Engine: useful interpretation, shared evidence
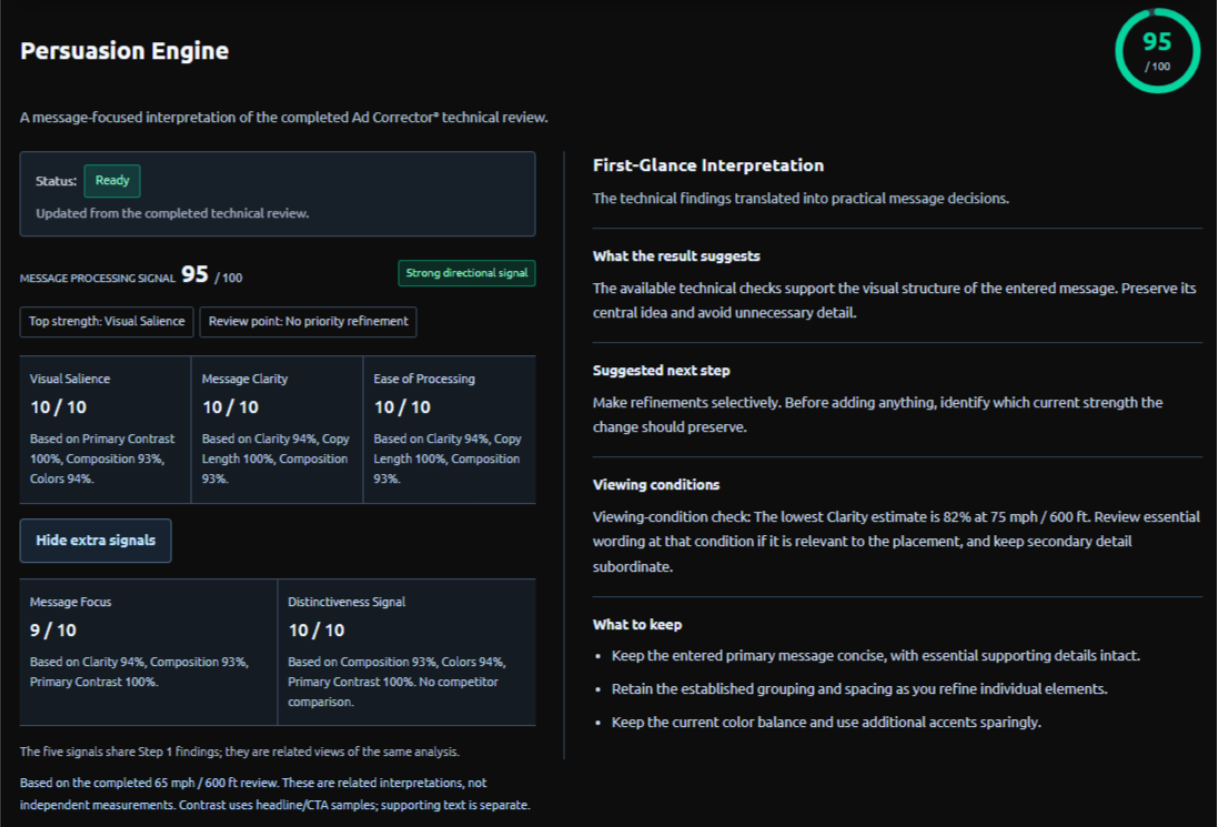
The Persuasion Engine returned a 95/100 message-processing signal. Its displayed signals were Visual Salience 10/10, Message Clarity 10/10, Ease of Processing 10/10, Message Focus 9/10, and Distinctiveness 10/10.
Those labels need context. The signals reinterpret the completed technical review, so they are related views of the same evidence rather than a second test. The Distinctiveness signal does not include a competitor comparison, and the result is not a measured persuasion rate. The practical guidance was to preserve the central idea and make refinements selectively, which is consistent with the strong technical result.
Putting the artwork into an illustrative scene
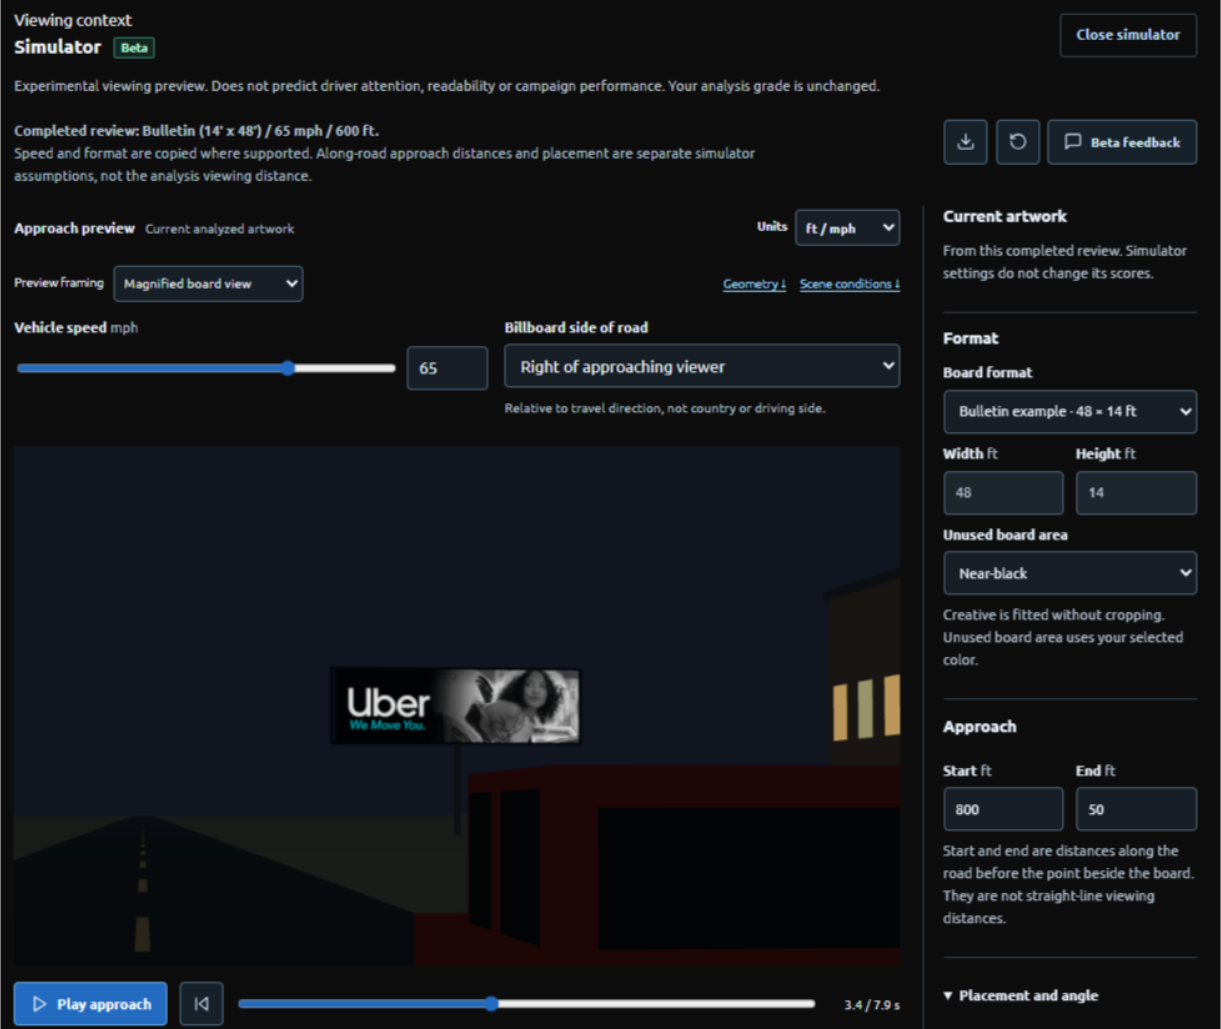
The simulator gives the artwork a setting beyond the design canvas. That can prompt useful questions about placement, angle, and visual surroundings.
Keep the settings distinct. The completed analysis used a 600-foot viewing distance. The simulator's 800–50-foot values describe distances along the road before the point beside the board. Those are different geometric quantities. The scene also cannot establish real nighttime illumination or display performance.
My verdict: preserve the hierarchy
I would keep the large wordmark, the short supporting line, and the clear division between brand and photograph. The tool identified no priority changes. Nothing in this review gives me a strong reason to force another element into the design.
A useful creative review should be able to tell you when to stop adding things.
I would still want the actual placement brief and final production file before approving a real installation. And I would want audience evidence before claiming the line delivered its intended meaning.
The high score does not make the photograph interchangeable. The tool has not compared different images or measured how this person's expression affects interpretation. That remains part of the creative discussion.
Five checks to borrow for your own board
You do not need Uber’s budget to use the discipline in this execution. These five checks come straight from what this review recorded.
- Give one element the lead. Here the wordmark is the largest thing on the board, and the tagline supports it. Ask which single element on your board should win, then check that it does.
- Make every word earn its place. The test counted four entered words in total. Cut until each remaining word does a job the image cannot.
- Measure each line of text, not just the headline. The report sampled 20.56:1 for “Uber” and 14.73:1 for the tagline. Both are strong, but they are separate measurements.
- Keep text and photograph out of each other’s way. The photograph sits on the right, apart from the wording. Crowding them is where many boards lose clarity.
- Review the final file at the real viewing conditions. This test used a web screenshot at assumed settings. Before launch, check the production file at your actual speed and distance.
What different advertisers can take from this
Small business owners: Preserve the discipline, then ask whether a stranger understands your business. A familiar brand can supply context that a new company may need to state. Short copy is valuable when it carries enough meaning.
Students and developing designers: Separate observation from inference. You can identify the largest lettering and record a contrast sample. You need different evidence to claim what people notice, understand, or remember.
OOH account executives and media owners: Record the actual format and intended viewing conditions. A presentation image and a passing score are not substitutes for checking the final file against the placement.
Agency creative directors and brand teams: Use technical findings to interrogate the execution. Preserve the concept where it is doing useful work. Investigate weaknesses where the evidence points to them. A review should sharpen judgment, not generate revisions simply to justify itself.
See the complete exported report
Creative source and review disclosure
Evidence record: Scores, entered copy, method version, and measurement coverage were transcribed from the completed October 30, 2026 Ad Corrector report and associated screenshots. The revised simulator screenshot provides the separate approach settings. No audience or field-performance study was conducted for this entry.
Creative image source: Whistler Billboards, “Billboard Advertising in the Topeka, KS area.” The reviewed artwork was sourced from this page. The page does not establish the originating creative agency, campaign dates, or whether this particular execution ran at the advertised Topeka location. Whistler Billboards is credited as the image source, not as the verified creator of the ad. The format and viewing conditions used here remain stated test assumptions.
This is an independent editorial review by Ad Corrector of Uber-branded artwork, offered for commentary and analysis. It is not presented as a commissioned Uber study, and it is not affiliated with or endorsed by Uber. Uber and related names are trademarks of their respective owners. The assessment concerns the supplied image under stated assumptions. Campaign effectiveness and actual audience response were not measured.
How these reviews work
Each entry starts with independently created advertising and a recorded set of test inputs. Ad Corrector applies rule-based checks to the image, confirmed copy, campaign goal, and selected conditions. The review then explains the findings in plain language.
The screenshots and report provide the test record. The commentary supplies editorial judgment. Where a placement detail is unknown, it is identified as an assumption. Where a result cannot answer a question, that limit stays visible.
A review can support a decision to investigate, revise, or preserve an execution. It cannot supply campaign results that were never collected.
The reasoning behind the approach is documented on the Scientific Foundations page. Common Methods Used to Test Billboard Ads covers other testing methods and their limits, and the billboard testing glossary defines the terms used here.
Questions about the Uber billboard test
Did Uber’s “We Move You” creative pass this test?
The supplied image received grade A and a 96/100 weighted visibility index in Brand Awareness mode at the selected 65 mph / 600-foot conditions. No priority changes were identified. This is a result within Ad Corrector’s method, not production approval or proof of campaign effectiveness.
What makes Uber’s “We Move You” billboard easy to read at speed?
In this review the strongest qualities were a large brand wordmark, one short supporting line (four entered words in total), high sampled text contrast, and clear separation between the brand and the photograph. Those qualities support legibility and visual clarity under the tested conditions. The test did not measure recall, persuasion, or ride bookings, so it does not show that the campaign worked.
Why was there no call-to-action penalty?
The review used Brand Awareness mode. CTA scoring was excluded. The absence of an instruction such as “Book now” was therefore not treated as a missing response element.
Does the result mean the ad persuaded 95% of people?
No. The 95/100 Persuasion Engine signal is derived from the technical findings. No audience persuasion rate was measured.
Can a screenshot produce the same result as the original artwork?
It may differ. Resolution, compression, cropping, and color changes can affect analysis. For a pre-launch decision, review the final artwork and confirm that all entered text matches the file.
Can one brand’s grade be compared directly with another’s?
Only with the inputs and purposes in view. Campaign goal, format, copy, image quality, settings, and scoring version can affect the result. The grades do not rank the brands’ overall creative quality or business performance.
How does Ad Corrector calculate these scores?
Ad Corrector applies rule-based checks to the image, the confirmed copy, the campaign goal, and the selected speed and distance. The reasoning behind the approach is documented on the Scientific Foundations page, and Common Methods Used to Test Billboard Ads covers other testing methods and their limits.